
Excel PivotTables Training Course
Key information
Upcoming sessions
Would you like to schedule this training on a specific date? Contact us by email or via the contact form.
Description of the training: Excel PivotTables Training Course
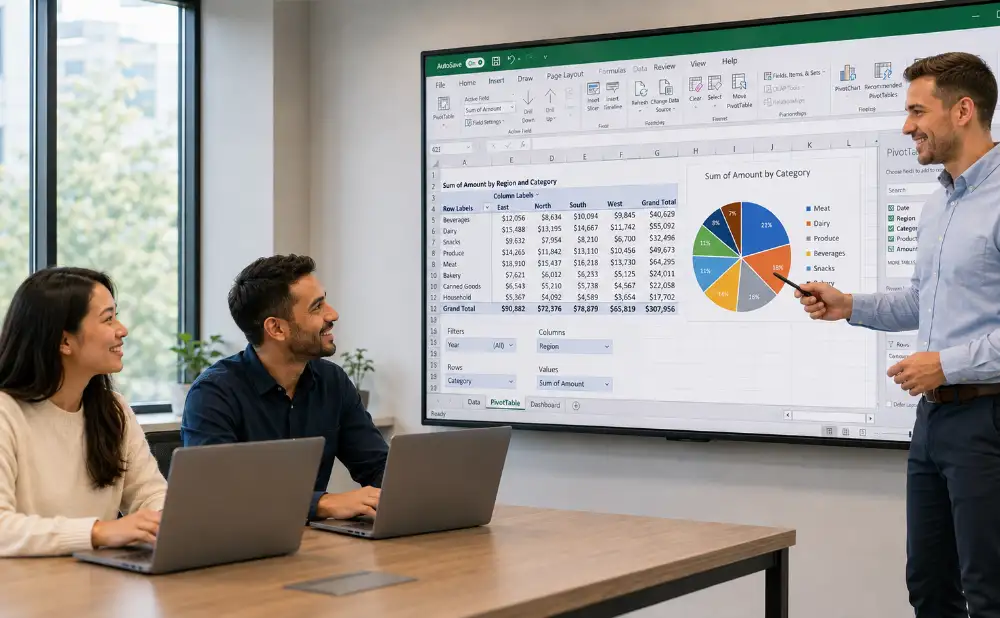
This Excel PivotTables training course is entirely dedicated to the spreadsheet’s most powerful analysis tool. Over two highly practical days, you will learn to prepare your data, create and format PivotTables, then group, filter and calculate to make your figures speak in just a few clicks, without writing a single formula. You will make your analyses interactive with slicers and the timeline, and build PivotCharts and clear dashboards. By the end, you will be able to analyse large volumes of data quickly and reliably.
Complementary courses: to go further, also discover Excel Advanced Skills Training Course, Excel Data Visualisation & Dashboards Training Course and Excel Data Analysis & Automation Training Course.
Good to know
The sessions are guaranteed from the first registration (except in cases of force majeure).
A preliminary interview takes place between the participant and/or a company contact in order to fully take into account the participant’s profile (level, needs, professional context, challenges, etc.).
Assessment: during the course, the trainer assesses participants’ learning progress through quizzes, role-play and practical exercises. Participants receive a certificate of completion at the end of the course.
This training course is part of our Power Platform Training Courses catalogue. Explore all our Power Platform courses to automate, analyse and build your business applications without code.
Objectives of the training: Excel PivotTables Training Course
By the end of the course, participants will be able to:
- prepare and structure data for analysis;
- create, format and refresh a PivotTable;
- group, sort and filter data;
- add calculated fields and items;
- make the analysis interactive with slicers and the timeline;
- design PivotCharts and dashboards.
Prerequisites of the training: Excel PivotTables Training Course
To follow this course under the best conditions, it is recommended to have completed the Excel Intermediate training course or to have equivalent knowledge: basic formulas, formatting, managing data lists. Because every participant is unique, a personalised interview is held beforehand in order to adapt the pace and practical cases to your context.
Detailed programme of the training: Excel PivotTables Training Course
Preparing your data for a PivotTable
- Organise a clean database (columns, headers, no empty rows). Format data as a structured table. Check data quality and handle duplicates. Consolidate several sources if necessary.
Creating and formatting a PivotTable
- Create a PivotTable from a database. Arrange fields in rows, columns, values and filters. Format and customise the display. Refresh the data and change the source.
Grouping, filtering and calculating
- Group data (dates, numerical bands). Sort and filter within the PivotTable. Change the calculations (sum, average, percentage, running total). Create calculated fields and items.
Slicers, timeline and interactivity
- Add slicers to filter visually. Use the timeline to filter by period. Connect several PivotTables to the same slicer. Make dashboards dynamic and interactive.
PivotCharts and dashboards
- Create a PivotChart and choose the right representation. Combine several PivotTables and charts in a dashboard. Formatting and readability. Distribute and share your analyses.
The highlights of this training course
- This course: focuses on practice with around 60% of hands-on exercises in Excel; lets you work on your own data; takes place in a small group of 1 to 3 participants; is led by an expert trainer; leads to a certificate of completion.
FAQ
What is a PivotTable?
A PivotTable is an Excel tool that summarises and analyses large volumes of data without writing a formula. In just a few clicks, you group, filter and calculate totals, averages or percentages across several analysis dimensions. This is the central focus of this course.
Do you need to know how to write formulas to create a PivotTable?
No. The strength of the PivotTable is precisely that it enables powerful analyses without formulas. A good grasp of the Excel basics (data entry, data lists, formatting) is enough to follow the course under good conditions.
What is the difference between a PivotTable and a PivotChart?
The PivotTable summarises data in table form; the PivotChart provides a linked, interactive visual representation of it. Both are covered in the course, along with slicers and the timeline to build genuine dashboards.
How long does the Excel PivotTables training course last?
The course lasts 2 days, i.e. 14 hours. Sessions are guaranteed from the first registration and take place in a small group of 1 to 3 participants. The programme can be customised and organised at your premises.
Is this course eligible for CPF or OPCO funding?
This course is funded directly by the company and is not eligible for CPF. Depending on your situation, funding by your OPCO may be considered: contact us to explore the funding options suited to your project.
.elementor-accordion .elementor-tab-title .elementor-accordion-icon{margin-right:10px}.elementor-accordion .elementor-tab-title .elementor-accordion-icon + a,.elementor-accordion .elementor-tab-title .elementor-accordion-title{padding-left:4px}